You're clear for launch.
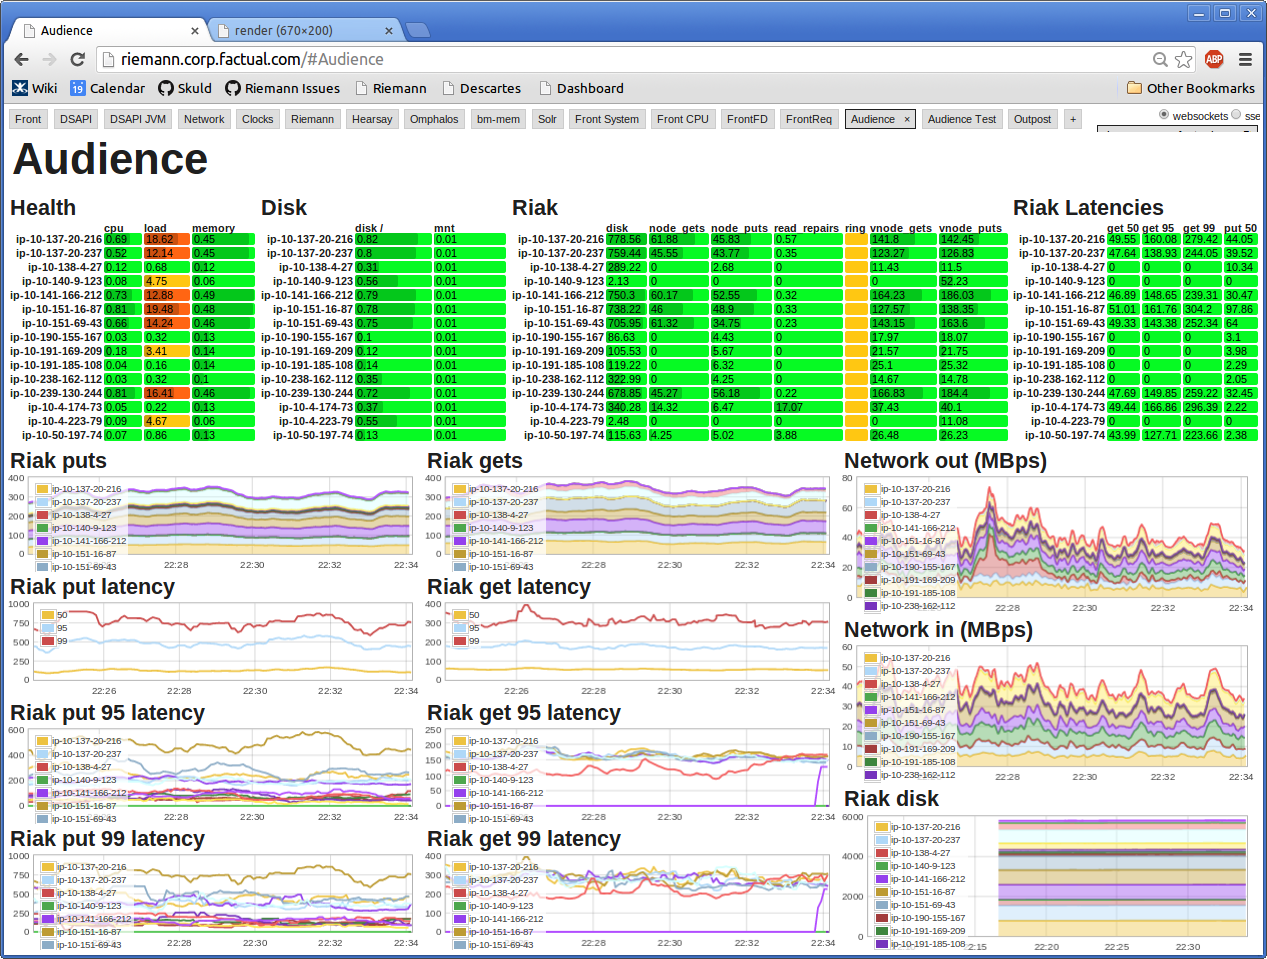
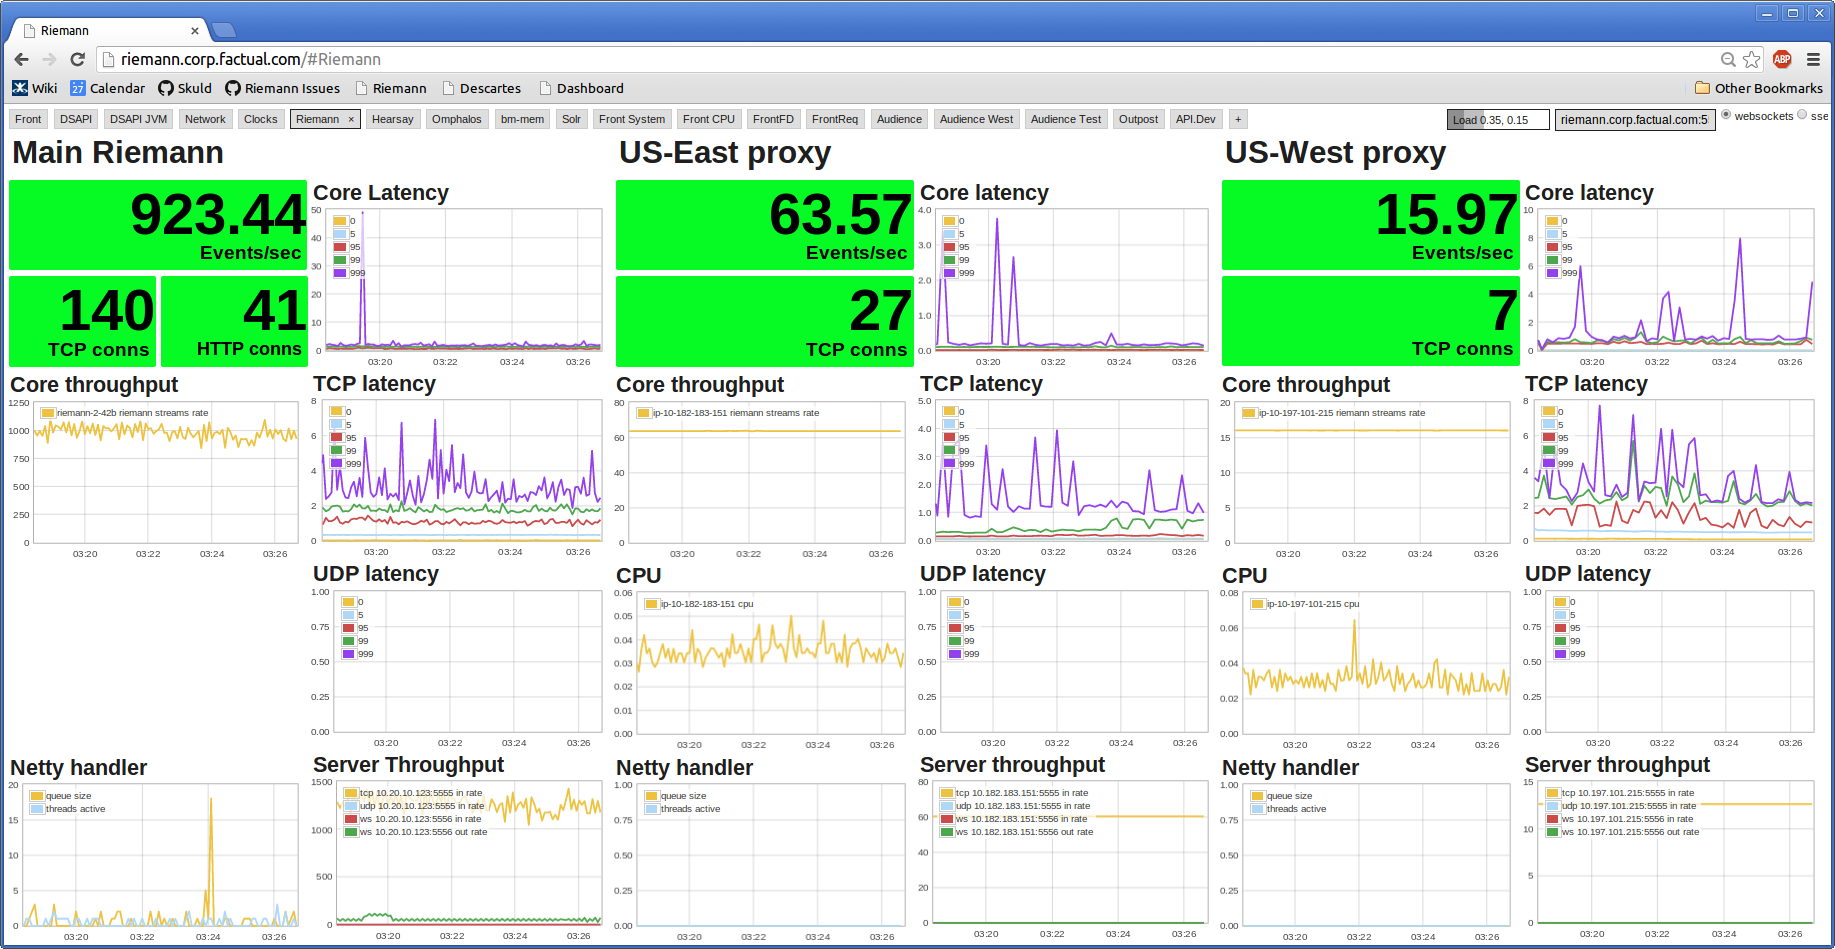
Riemann-dash 0.2.0 is here. It uses websockets and some terrifying javascript to let you compose fully interactive, low-latency visualizations of Riemann's index.
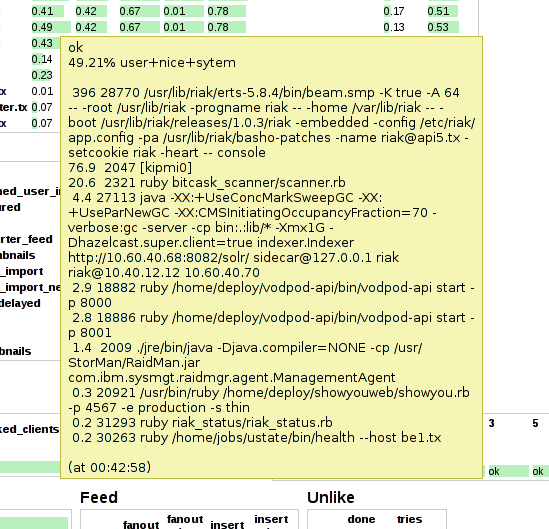
0.2.0 includes a tiling window manager. Each workspace (top right) is an arrangement of views. Each view is a single query, visualized in a specific way. I've only written two views so far--a single-cell "Gauge" and the familiar host-by-service table. I'll be adding new types of views over time; expect time-series plots and scrolling logs, for starters.
There's a basic keyboard control scheme that'll greet you on first start up. When you're happy with your layout, just hit "s" to save. Riemann-dash will store your config as a JSON file in the config/ directory.
Get started at Github, or see the quickstart guide. It's available as a Gem.
Frontend design is not my strong suit. The dashboard is full of
rough edges, and though I've put several hundred hours into it... this is
just the start. You'll find CSS in lib/riemann/dash/views/,
and JS in lib/riemann/dash/public/. Try writing a view, based
on views/gauge.js, to get familiar with the codebase.
Pierre-Yves Ritschard of Exoscale has put together a simple grid view for Riemann events: https://github.com/exoscale/riemann-grid.
Gergely Nagy has put together a text-based dashboard for Riemann events: https://git.madhouse-project.org/algernon/potential-happiness.
Anthony Galea has put together a Riemann console: https://github.com/anthonygalea/riemann-console.
Fabien Wernli has implemented a Grafana Datasource plugin: https://github.com/faxm0dem/grafana-riemann-websocket-datasource/.